Geant4  9.6.p02
 All Classes Namespaces Files Functions Variables Typedefs Enumerations Enumerator Friends Macros Groups Pages
Functions | Variables
plot.C File Reference

Go to the source code of this file.

Functions

gStyle SetOptStat (0000)
 
gStyle SetOptFit ()
 
gStyle SetPalette (1)
 
gROOT SetStyle ("Plain")
 
c1 Divide (4, 3)
 
 while (1)
 
 fclose (fp)
 
c1 cd (1)
 
h1 Draw ()
 
h1 GetXaxis () -> SetLabelSize(0.025)
 
h1 GetYaxis () -> SetLabelSize(0.025)
 
h1 SetLineColor (3)
 
h1 SetFillColor (3)
 
h11 SetLineColor (8)
 
h11 SetFillColor (8)
 
h11 Draw ("same")
 
c1 cd (5)
 
h2 SetLineColor (2)
 
h2 SetFillColor (2)
 
h20 SetLineColor (5)
 
h20 SetFillColor (5)
 
c1 cd (7)
 
ntupleYX Draw ("Y:X>>hist","vox","colz")
 
gPad SetLogz ()
 
hist Draw ("colz")
 
hist GetZaxis () -> SetLabelSize(0.025)
 
hist SetTitle ("Cytoplasm intensity on transverse section")
 
c1 cd (3)
 
hist SetTitle ("Nucleus intensity on transverse section")
 
TFile f ("microbeam.root")
 
c1 cd (2)
 
ntuple3 Project ("h1","doseN")
 
h1 Scale (scale)
 
c1 cd (6)
 
ntuple3 Project ("h10","doseC")
 
c1 cd (9)
 
ntuple0 Project ("h2","sp")
 
h2 SetTitle ("dE/dx at cell entrance")
 
h2 SetFillColor (4)
 
h2 SetLineColor (4)
 
h2 Fit ("gaus")
 
gaus SetLineColor (6)
 
ntuple2 SetBranchAddress ("x",&x)
 
ntuple2 SetBranchAddress ("y",&y)
 
ntuple2 SetBranchAddress ("z",&z)
 
 for (Int_t i=0;i< nentries;i++)
 
c1 cd (10)
 
ntupleR Draw ("X2:Z2","abs(X2)<50","surf3")
 
c1 cd (11)
 
ntuple4 Draw ("y*0.359060:x*0.359060>>hist","doseV","contz")
 
hist Draw ("contz")
 
hist SetTitle ("Mean energy deposit -transverse- (z axis in eV)")
 
c1 cd (12)
 
ntuple4 Draw ("x*0.359060:z*0.162810>>hist","doseV","contz")
 
hist SetTitle ("Mean energy deposit -longitudinal- (z axis in eV)")
 
c1 cd (4)
 
ntuple1 Project ("hx","x")
 
h77 SetTitle ("Beam X position on cell")
 
c1 cd (8)
 
ntuple1 Project ("hy","y")
 
h88 SetTitle ("Beam Y position on cell")
 

Variables

Double_t scale = 1/h1->Integral()
 
 c1 = new TCanvas ("c1","",20,20,1200,900)
 
jump __pad0__
 
jump r
 
Float_t xVox
 
Float_t yVox
 
Float_t zVox
 
Float_t tmp
 
Float_t den
 
Float_t dose
 
Float_t X
 
Float_t Y
 
Float_t Z
 
Float_t vox = 0
 
Float_t mat = 0
 
Float_t voxelSizeX
 
Float_t voxelSizeY
 
Float_t voxelSizeZ
 
TH1F * h1 = new TH1F("h1","Nucleus marker intensity",100,1,300)
 
TH1F * h11 = new TH1F("h11 ","",100,1,300)
 
TH1F * h2 = new TH1F("h2","Cytoplasm marker intensity",100,1,300)
 
TH1F * h20 = new TH1F("h20 ","",100,1,300)
 
TNtuple * ntupleYXN = new TNtuple("NUCLEUS","ntuple","Y:X:vox")
 
TNtuple * ntupleZX = new TNtuple("CYTOPLASM","ntuple","Z:X:vox")
 
TNtuple * ntupleYX = new TNtuple("CYTOPLASM","ntuple","Y:X:vox")
 
 nlines =0
 
 ncols =0
 
TH2F * hist = new TH2F("hist","hist",50,-20,20,50,-20,20)
 
TNtuple * ntuple0 = (TNtuple*)f->Get("ntuple0")
 
TNtuple * ntuple1 = (TNtuple*)f->Get("ntuple1")
 
TNtuple * ntuple2 = (TNtuple*)f->Get("ntuple2")
 
TNtuple * ntuple3 = (TNtuple*)f->Get("ntuple3")
 
TNtuple * ntuple4 = (TNtuple*)f->Get("ntuple4")
 
TH1F * h10 = new TH1F("h10","Dose distribution in Cytoplasm",100,0.001,.2)
 
Float_t d
 
Double_t Xc = -1295.59e3 - 955e3*sin(10*TMath::Pi()/180)
 
Double_t Zc = -1327e3 + 955e3*cos(10*TMath::Pi()/180)
 
Double_t X1
 
Double_t Y1
 
Double_t Z1
 
Double_t X2
 
Double_t Y2
 
Double_t Z2
 
TNtuple * ntupleR = new TNtuple("Rmax","ntuple","Z2:Y2:X2")
 
Double_t x
 
Double_t y
 
Double_t z
 
Double_t xx
 
Double_t zz
 
Int_t nentries = (Int_t)ntuple2->GetEntries()
 
TH1F * h77 = new TH1F("hx","h1",200,-10,10)
 
TH1F * h88 = new TH1F("hy","h1",200,-10,10)
 

Function Documentation

c1 cd ( )
c1 cd ( )
c1 cd ( )
c1 cd ( )
c1 cd ( )
c1 cd ( )
c1 cd ( )
c1 cd ( 10  )
c1 cd ( 11  )
c1 cd ( 12  )
c1 cd ( )
c1 cd ( )
c1 Divide ( ,
 
)
h1 Draw ( )
h11 Draw ( "same"  )
ntupleYXN Draw ( "Y:X>>hist ,
"vox"  ,
"colz"   
)
hist Draw ( "colz"  )
ntupleR Draw ( "X2:Z2"  )
ntuple4 Draw ( "y*0.359060:x*0.359060>>hist ,
"doseV"  ,
"contz"   
)
hist Draw ( "contz"  )
ntuple4 Draw ( "x*0.359060:z*0.162810>>hist ,
"doseV"  ,
"contz"   
)
TFile f ( "microbeam.root"  )
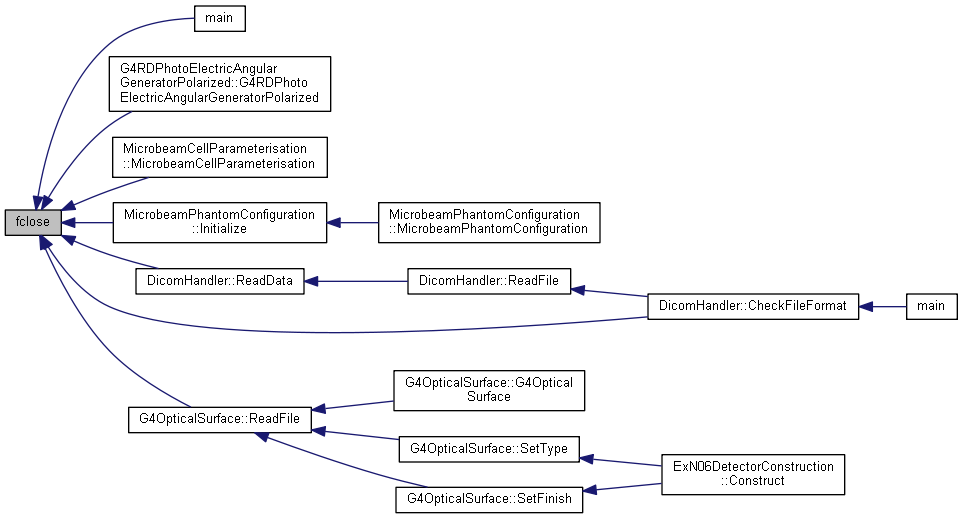
fclose ( fp  )

Here is the caller graph for this function:

h88 Fit ( "gaus"  )
for ( )

Definition at line 281 of file plot.C.

h88 GetXaxis ( ) -> SetLabelSize(0.025)
h88 GetYaxis ( ) -> SetLabelSize(0.025)
hist GetZaxis ( ) -> SetLabelSize(0.025)
ntuple3 Project ( "h1"  ,
"doseN"   
)
ntuple3 Project ( "h10"  ,
"doseC"   
)
ntuple0 Project ( "h2"  ,
"sp"   
)
ntuple1 Project ( "hx"  ,
"x"   
)
ntuple1 Project ( "hy"  ,
"y"   
)
h88 Scale ( scale  )
ntuple2 SetBranchAddress ( "x"  ,
x 
)
ntuple2 SetBranchAddress ( "y"  ,
y 
)
ntuple2 SetBranchAddress ( "z"  ,
z 
)
h1 SetFillColor ( )
h11 SetFillColor ( )
h2 SetFillColor ( )
h20 SetFillColor ( )
h2 SetFillColor ( )
h1 SetLineColor ( )
h11 SetLineColor ( )
h10 SetLineColor ( )
h20 SetLineColor ( )
h88 SetLineColor ( )
gaus SetLineColor ( )
gPad SetLogz ( )
gStyle SetOptFit ( )
gStyle SetOptStat ( 0000  )
gStyle SetPalette ( )
gROOT SetStyle ( "Plain"  )
hist SetTitle ( "Cytoplasm intensity on transverse section"  )
hist SetTitle ( "Nucleus intensity on transverse section"  )
h2 SetTitle ( "dE/dx at cell entrance"  )
hist SetTitle ( "Mean energy deposit -transverse- (z axis in eV)"  )
hist SetTitle ( "Mean energy deposit -longitudinal- (z axis in eV)"  )
h77 SetTitle ( "Beam X position on cell"  )
h88 SetTitle ( "Beam Y position on cell"  )
while ( )

Definition at line 56 of file plot.C.

Variable Documentation

jump __pad0__

Definition at line 36 of file plot.C.

c1 = new TCanvas ("c1","",20,20,1200,900)

Definition at line 28 of file plot.C.

Float_t d

Definition at line 234 of file plot.C.

Float_t den

Definition at line 37 of file plot.C.

Float_t dose

Definition at line 37 of file plot.C.

TH1F * h1 = new TH1F("h1","Nucleus marker intensity",100,1,300)

Definition at line 43 of file plot.C.

TH1F* h10 = new TH1F("h10","Dose distribution in Cytoplasm",100,0.001,.2)

Definition at line 186 of file plot.C.

TH1F* h11 = new TH1F("h11 ","",100,1,300)

Definition at line 44 of file plot.C.

TH1F * h2 = new TH1F("h2","Cytoplasm marker intensity",100,1,300)

Definition at line 46 of file plot.C.

TH1F* h20 = new TH1F("h20 ","",100,1,300)

Definition at line 47 of file plot.C.

TH1F* h77 = new TH1F("hx","h1",200,-10,10)

Definition at line 363 of file plot.C.

TH1F* h88 = new TH1F("hy","h1",200,-10,10)

Definition at line 364 of file plot.C.

TH2F * hist = new TH2F("hist","hist",50,-20,20,50,-20,20)

Definition at line 136 of file plot.C.

Float_t mat = 0

Definition at line 40 of file plot.C.

ncols =0

Definition at line 54 of file plot.C.

Int_t nentries = (Int_t)ntuple2->GetEntries()

Definition at line 280 of file plot.C.

nlines =0

Definition at line 53 of file plot.C.

ntuple0 = (TNtuple*)f->Get("ntuple0")

Definition at line 173 of file plot.C.

ntuple1 = (TNtuple*)f->Get("ntuple1")

Definition at line 174 of file plot.C.

ntuple2 = (TNtuple*)f->Get("ntuple2")

Definition at line 175 of file plot.C.

ntuple3 = (TNtuple*)f->Get("ntuple3")

Definition at line 176 of file plot.C.

ntuple4 = (TNtuple*)f->Get("ntuple4")

Definition at line 177 of file plot.C.

TNtuple* ntupleR = new TNtuple("Rmax","ntuple","Z2:Y2:X2")

Definition at line 275 of file plot.C.

TNtuple* ntupleYX = new TNtuple("CYTOPLASM","ntuple","Y:X:vox")

Definition at line 51 of file plot.C.

TNtuple* ntupleYXN = new TNtuple("NUCLEUS","ntuple","Y:X:vox")

Definition at line 49 of file plot.C.

TNtuple* ntupleZX = new TNtuple("CYTOPLASM","ntuple","Z:X:vox")

Definition at line 50 of file plot.C.

jump r

Definition at line 36 of file plot.C.

scale = 1/h1->Integral()

Definition at line 25 of file plot.C.

Float_t tmp

Definition at line 37 of file plot.C.

Float_t vox = 0

Definition at line 40 of file plot.C.

Float_t voxelSizeX

Definition at line 41 of file plot.C.

Float_t voxelSizeY

Definition at line 41 of file plot.C.

Float_t voxelSizeZ

Definition at line 41 of file plot.C.

Float_t X

Definition at line 39 of file plot.C.

Double_t x

Definition at line 276 of file plot.C.

Double_t X1

Definition at line 263 of file plot.C.

Double_t X2

Definition at line 263 of file plot.C.

Xc = -1295.59e3 - 955e3*sin(10*TMath::Pi()/180)

Definition at line 263 of file plot.C.

Float_t xVox

Definition at line 37 of file plot.C.

Double_t xx

Definition at line 276 of file plot.C.

Float_t Y

Definition at line 39 of file plot.C.

Double_t y

Definition at line 276 of file plot.C.

Double_t Y1

Definition at line 263 of file plot.C.

Double_t Y2

Definition at line 263 of file plot.C.

Float_t yVox

Definition at line 37 of file plot.C.

Float_t Z

Definition at line 39 of file plot.C.

Double_t z

Definition at line 276 of file plot.C.

Double_t Z1

Definition at line 263 of file plot.C.

Double_t Z2

Definition at line 263 of file plot.C.

Zc = -1327e3 + 955e3*cos(10*TMath::Pi()/180)

Definition at line 263 of file plot.C.

Float_t zVox

Definition at line 37 of file plot.C.

Double_t zz

Definition at line 276 of file plot.C.