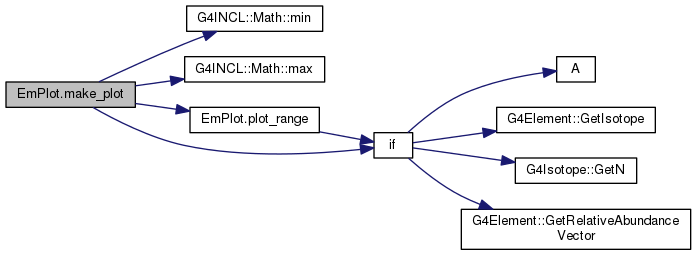
85 def make_plot(xlist, user_title, axis_titile, q_super_impose=0):
87 ekin_array, y_array = array(
'd'), array(
'd')
90 ekin_array.append(x[0])
102 if(q_super_impose==0):
105 frame= ROOT.TH1F(
"dumy", htit, 1, xrange[0], xrange[1]);
106 frame.SetMinimum(yrange[0]);
107 frame.SetMaximum(yrange[1]);
108 frame.SetXTitle(
"Kinetic Energy (MeV)")
109 frame.GetXaxis().SetLabelSize(0.025)
110 frame.GetXaxis().SetTitleSize(0.03)
111 frame.SetYTitle(axis_titile)
112 frame.GetYaxis().SetLabelSize(0.025)
113 frame.GetYaxis().SetTitleSize(0.03)
117 plot= ROOT.TGraph(len(ekin_array), ekin_array, y_array)
119 plot.SetLineColor(q_super_impose+1)
T max(const T t1, const T t2)
brief Return the largest of the two arguments
T min(const T t1, const T t2)
brief Return the smallest of the two arguments


